Content
1. Assessment of NSWRM effectiveness under current climate
The simulation of NSWRM effectiveness on water balance, crop yields and nutrient fluxes was carried out by seven Case Studies (CS) so far: CS1 (Schwarzer Schöps. Germany), CS3 (Csorsza. Hungary), CS4 (Upper Zglowiaczka. Poland), CS7 (Wimbe. Belgium), CS9 (Cherio, Italy), CS10 (Kråkstadelva, Norway) and CS11 (Tetves, Hungary).
A full harmonisation was not possible as the selection of measures and also their parameterisation can vary between CS.
A qualitative synthesis for the effectiveness of NSWRM across the CS in terms of:
- Water retention
- Nitrogen retention
- Phosphorus retention
Crop and soil management measures
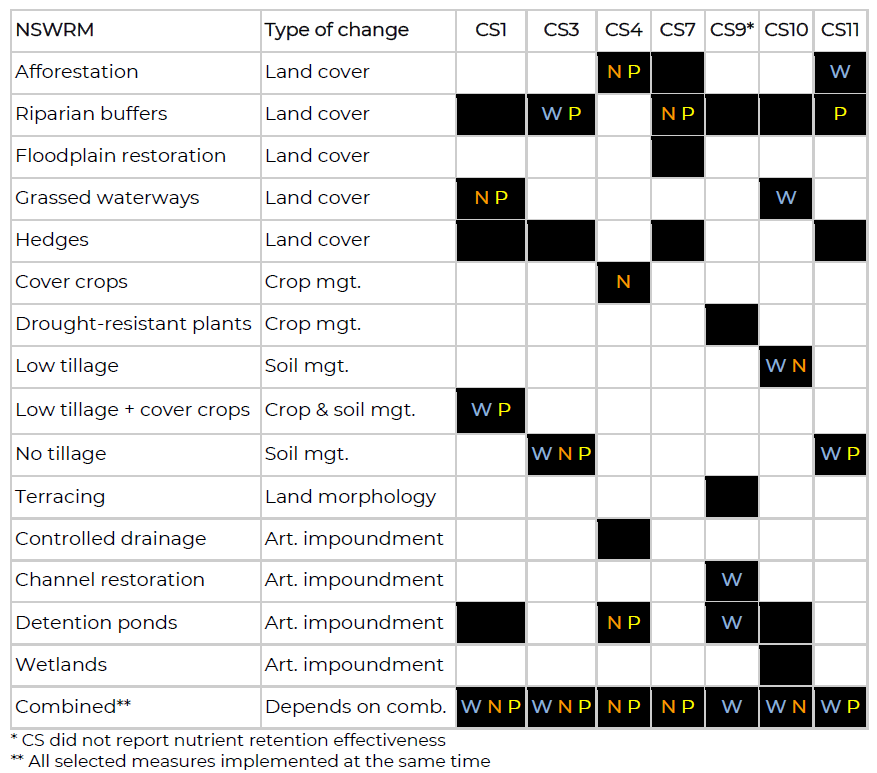
Measures such as low tillage, no tillage and cover crops were found to be effective in all of the five CS where this type of measure was modelled (CS1, CS3, CS4, CS10, CS11).
In most cases, low or no tillage and cover crops had no significant effect on crop yields, except in CS3 where yields increased by up to 28%. Drought-resistant plants (tested only in CS9) allowed savings in irrigation water, but at the cost of reduced crop yields.
Greening measures (conversion to permanent vegetation)
Five NSWRMs are characterised by the conversion of cropland into permanent vegetation cover (greening). Not all of these were found to be effective.
Hedges, for instance, were relatively ineffective in each of the four CS (CS1, CS3, CS7, CS10), while grassed waterways had a large effect in both CS that tested this measure (CS1 and CS10). A plausible (and trivial) pattern seems to emerge from the simulation results. The more targeted the spatial implementation of a measure, the greater its impact. Grassed waterways are implemented along erosive thalwegs with the main aim of reducing water erosion while hedges are usually implemented based on other spatial criteria (e.g. connecting habitats for nature conservation).
Riparian buffers: All CS except CS4 included riparian buffers. In 50% of the cases (three CS out of six), riparian buffers showed a significant retention effect (particularly in CS7, where the number and size of the buffers are much larger than in other CS).
Afforestation was the NSWRM with the largest area of implementation. It helped to retain nutrients in CS4 and water in CS11, while it was relatively ineffective in CS7. It is clear that greening comes at a cost to crop production. While in the majority of CS, greening measures used only a few percent of the total cropland, afforestation in CS11 was tested on almost 50% of cropland, with a corresponding reduction in total crop production.
Greening measures generally reduce cropland area and may decrease total crop production, particularly when implemented at large scale.
Artificial impoundments
The last group of NSWRMs represents artificial impoundments, which did not appear to have a major impact on basin-wide water and nutrient retention. Exceptions are detention ponds in CS4 and CS9 as well as channel restoration (simulated as constructed wetlands along the channel) in CS9.
Combined measures
Scenarios combining several measures produced the greatest impact in all CS. However, such a scenario may not be the most efficient, as some measures may partly overlap the effects of other measures (as observed in CS1 with lowtill + cover crops and grassed waterways).
Overall, the simulated NSWRM effectiveness appears plausible with the novel modelling approach developed and applied in OPTAIN. However, the results presented in the table below should be treated with caution, as the majority of modelling teams are likely to continue their efforts to make the results as realistic as possible (e.g. by improving the goodness-of-fit in the calibration, adding additional variables in the calibration, e.g. phosphorus, and updating the parameterisation of the measures). There may still be inconsistencies and implausibilities in the behaviour of individual measures that require a more careful investigation by each CS. This is particularly true for the parameterisation of greening measures.
Table: Overview of modelled NSWRM across case studies (black = NSWRM has been modelled). If a measure was predicted to be effective for retaining water (W), nitrogen (N), and/or phosphorus (P), this is indicated by respective letters
2. Assessment of NSWRM effectiveness under future climate
Climate change is expected to increase the frequency of extreme weather and hydrological events in Europe, threatening water retention and quality. The results presented in Section 3.4 show that in most cases the magnitude of high flow events and nutrient losses will indeed increase. It is therefore of great practical importance to assess the effectiveness of measures under future climate conditions.
At the time of assessment, combined climate change and NSWRM scenarios have only been run for CS1. To illustrate potential future dynamics, three different climate scenarios were selected:
- Cool & dry
- Cool & wet
- Warm & wet
The selection was based on projected changes in temperature and precipitation by the end of the century. The term 'cool' refers to low levels of warming, as all available scenarios project rising temperatures. As in central Europe high future warming is usually associated with increasing precipitation (Piniewski et al., 2018), no 'warm & dry' scenario could be identified. Selected water balance, water quality and crop yield indicators are plotted in Figures 1-3 ('cool & dry' scenario). Figures 4-6 ('cool & wet' scenario) and Figures 7-.9 ('warm & wet' scenario) for the 'historical' and 'end of century' time slices, respectively. The considered NSWRMs include: riparian buffer zones, grassed waterways, hedgerows, low tillage + cover crops, ponds (see OPTAIN D4.4 for more details).
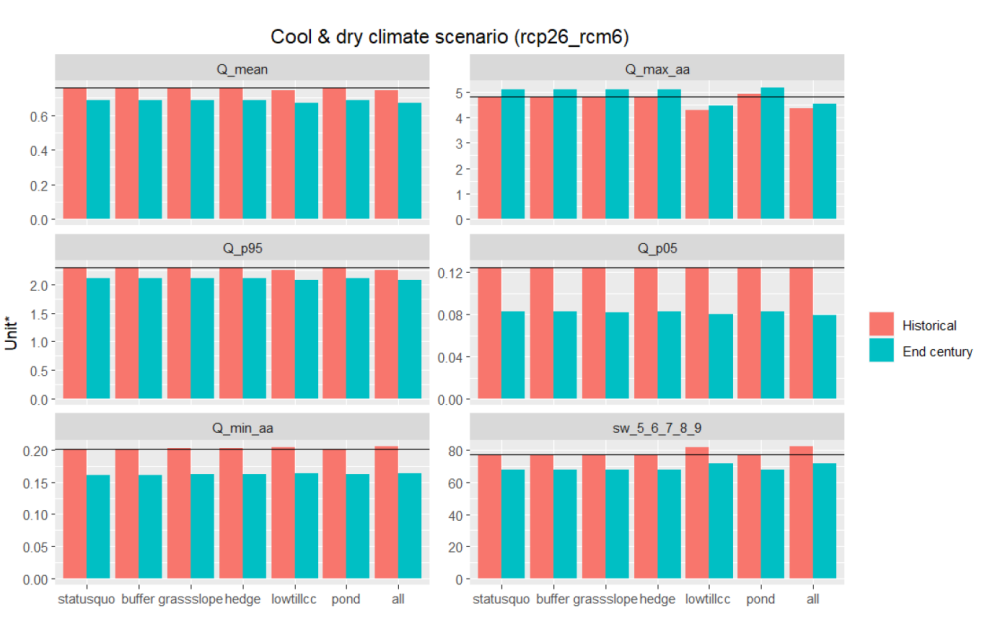
For the hydrological indicators (Fig. 1, 4, 7), the climate change signal (end of century vs. historical) is stronger than the effect of the NSWRM scenarios (NSWRM vs. status quo), except for the mean annual maximum discharge (‘Q_max_aa’), which indicates high flows and hence, potential flood risk. Under all climate change scenarios, ‘Q_max_aa’ is predicted to increase, particularly for the wet scenarios. However, implementation of the ‘lowtillcc’ scenario may not only prevent this high flow indicator from increasing, but may even reduce ‘Q_max_aa’. According to the model, this NSWRM would also mitigate, but not fully offset, the decrease in the growing season average soil moisture (‘sw_5_6_7_8_9’) under the ‘cool & dry’ scenario.
Figure 1. Comparison between the combined climate change + NSWRM scenarios for selected hydrological indicators in CS1.
The results illustrate simulated indicator values for a single climate scenario called “Cool & dry”. The units are [m3/s] for discharge (Q) indicators and [mm] for soil moisture. Black line refers to the indicator level for the historical ‘statusquo’ scenario that serves as a reference.
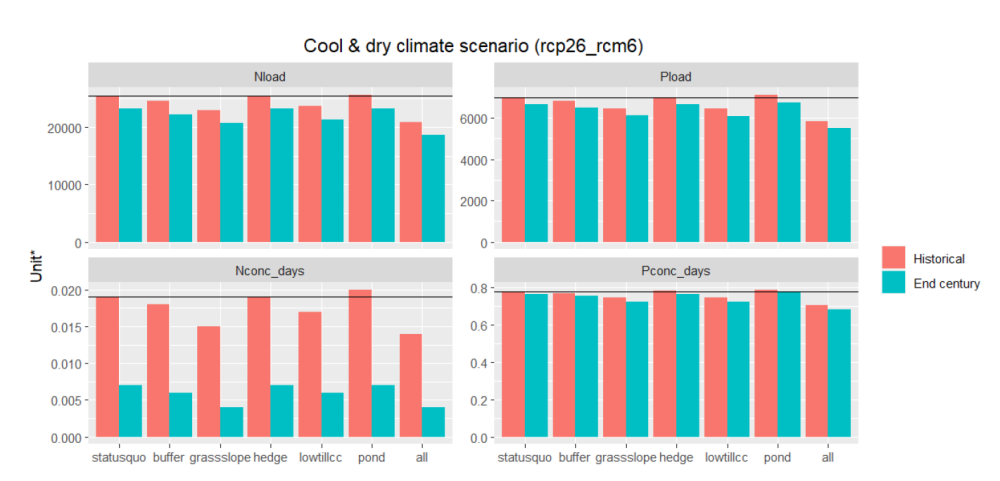
Nitrogen and phosphorus loads at the outlet of the CS1 catchment (‘Nload’ and ‘Pload’, respectively) are projected to decrease under the ‘cool & dry’ climate scenario (Figure 2). A decrease is certainly desirable for CS1 as nutrient export is one of the main challenges in this catchment. Under the grassed waterways (‘grassslope’), ‘lowtillcc’, and in particular the ‘all’ NSWRM scenario, the decrease would be much stronger. In contrast, N and P loads are predicted to increase significantly under the wet scenarios (Figures 4, 7). Such a decrease could be avoided by applying NSWRMs, but according to our model results only with a combined implementation of different NSWRMs (‘all’ scenario).
For the number of days with high nitrogen and phosphorus concentrations (‘Nconc_days’ and ‘Pconc_days’, respectively), the climate change signal was found to be stronger than the NSWRM effect under the ‘cool and dry’ climate but lower under wet climate. High concentrations are predicted to decrease under all climate scenarios (also despite increasing loads under wet climate due to dilution in the even stronger increasing discharge). Again, selected NSWRM scenarios (‘buffer’, ‘lowtillcc’, ‘grassslope’, ‘all’) can help to further reduce the number of days with high nutrient concentrations.
Figure 2 Comparison between the combined climate change + NSWRM scenarios for selected water quality indicators in CS1.
The results illustrate simulated indicator values for a single climate scenario called “Cool & dry”. The units are [kg/year] for load indicators and [-] for frequency indicators. Black line refers to the indicator level for the historical ‘statusquo’ scenario that serves as a reference.
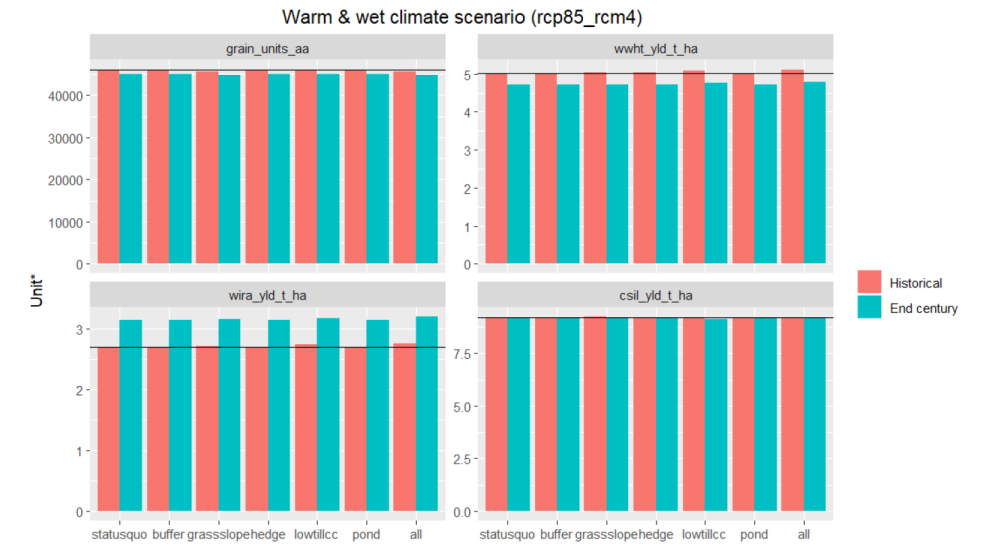
The predicted impact of NSWRMs on crop yields (Figure 3, 6, 9), in contrast, was only marginal. Any climate-induced decreasing crop yields (e.g. under ‘cool and dry’ climate), might not further decrease in CS1 due to the implementation of the considered NSWRM.
Figure 3. Comparison between the combined climate change + NSWRM scenarios for selected crop yield indicators in CS1.
The results illustrate simulated indicator values for a single climate scenario called “Cool & dry”. The units are [-] for grain units and [t/ha] for crop yields. Black line refers to the indicator level for the historical ‘statusquo’ scenario that serves as a reference.
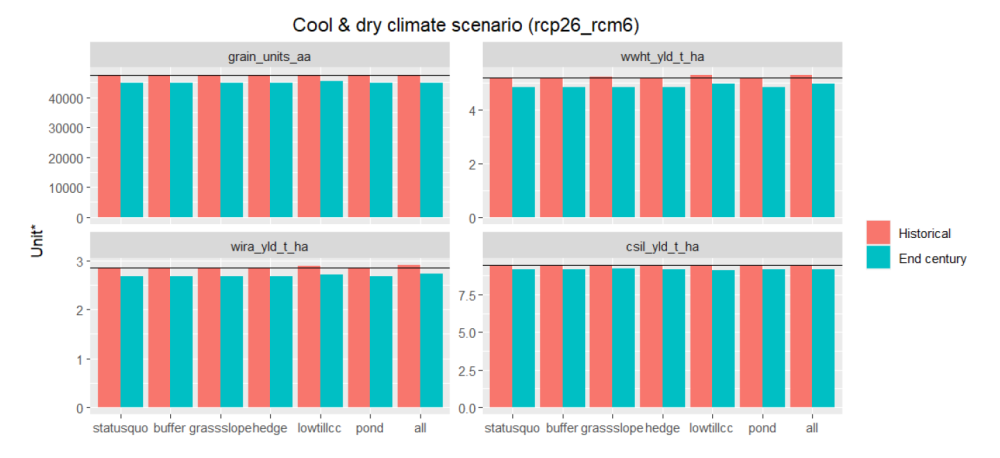
Figure 4. Comparison between the combined climate change + NSWRM scenarios for selected water balance indicators in CS1.
The results illustrate simulated indicator values for a single climate scenario called “Cool & wet”. The units are [m3/s] for discharge (Q) indicators and [mm] for soil moisture. Black line refers to the indicator level for the historical ‘statusquo’ scenario that serves as a reference.
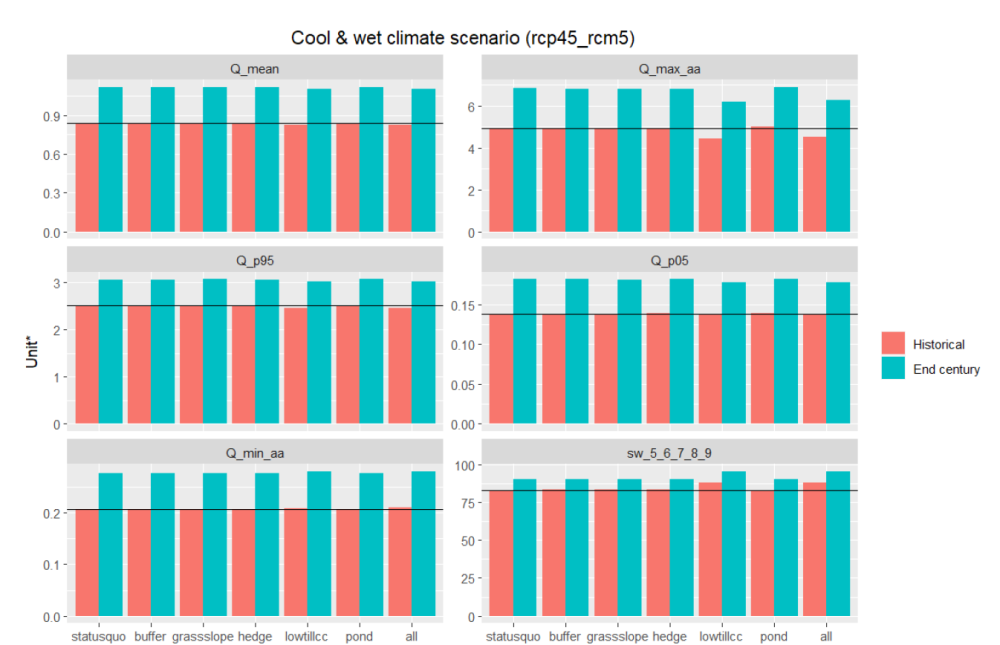
Figure 5. Comparison between the combined climate change + NSWRM scenarios for selected water quality indicators in CS1.
The results illustrate simulated indicator values for a single climate scenario called “Cool & wet”. The units are [kg/year] for load indicators and [-] for frequency indicators. Black line refers to the indicator level for the historical ‘statusquo’ scenario that serves as a reference.
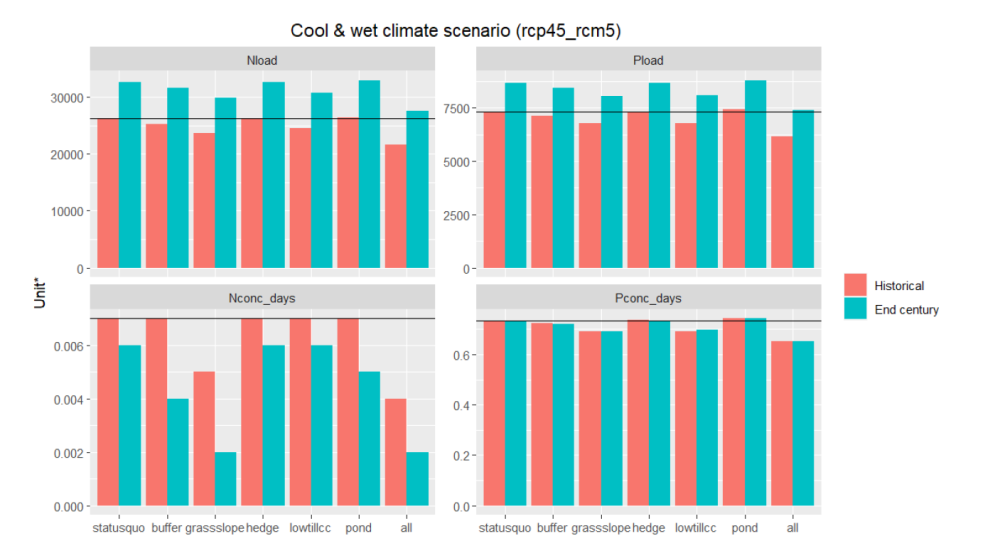
Figure 6. Comparison between the combined climate change + NSWRM scenarios for selected crop yield indicators in CS1.
The results illustrate simulated indicator values for a single climate scenario called “Cool & wet”. The units are [-] for grain units and [t/ha] for crop yields. Black line refers to the indicator level for the historical ‘statusquo’ scenario that serves as a reference.
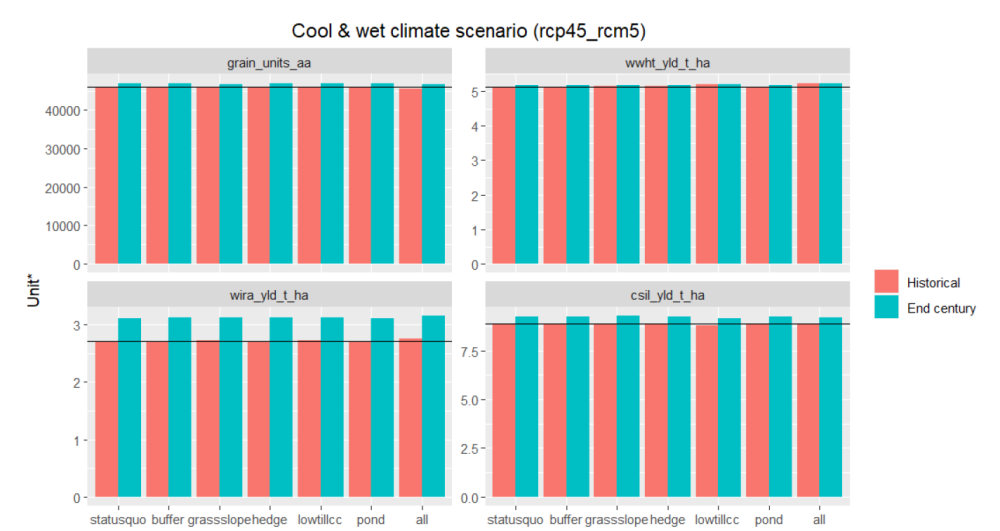
Figure 7 Comparison between the combined climate change + NSWRM scenarios for selected water balance indicators in CS1.
The results illustrate simulated indicator values for a single climate scenario called “Warm & wet”. The units are [m3/s] for discharge (Q) indicators and [mm] for soil moisture. Black line refers to the indicator level for the historical ‘statusquo’ scenario that serves as a reference.
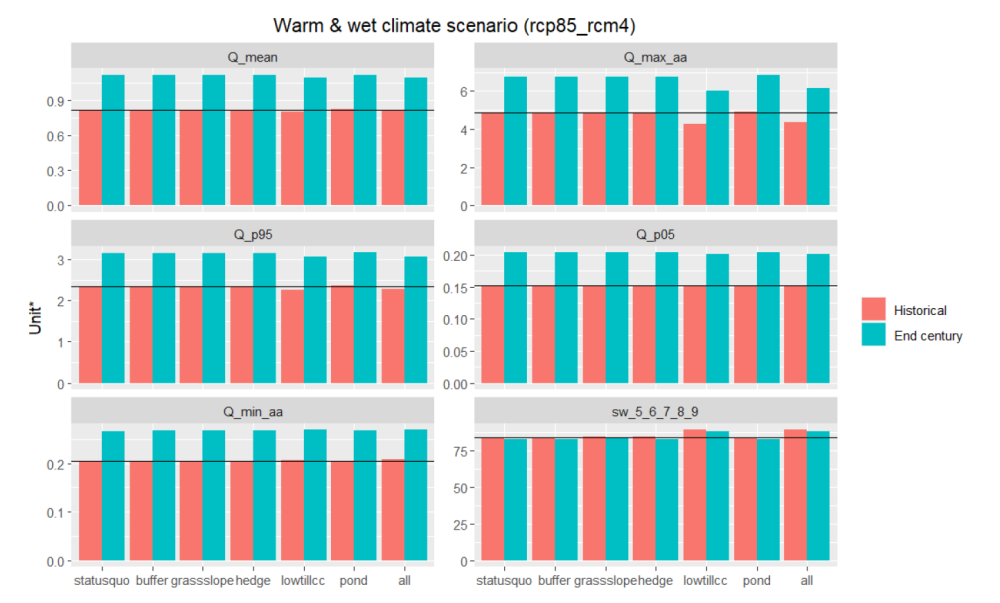
Figure 8 Comparison between the combined climate change + NSWRM scenarios for selected water quality indicators in CS1.
The results illustrate simulated indicator values for a single climate scenario called “Warm & wet”. The units are [kg/year] for load indicators and [-] for frequency indicators. Black line refers to the indicator level for the historical ‘statusquo’ scenario that serves as a reference.
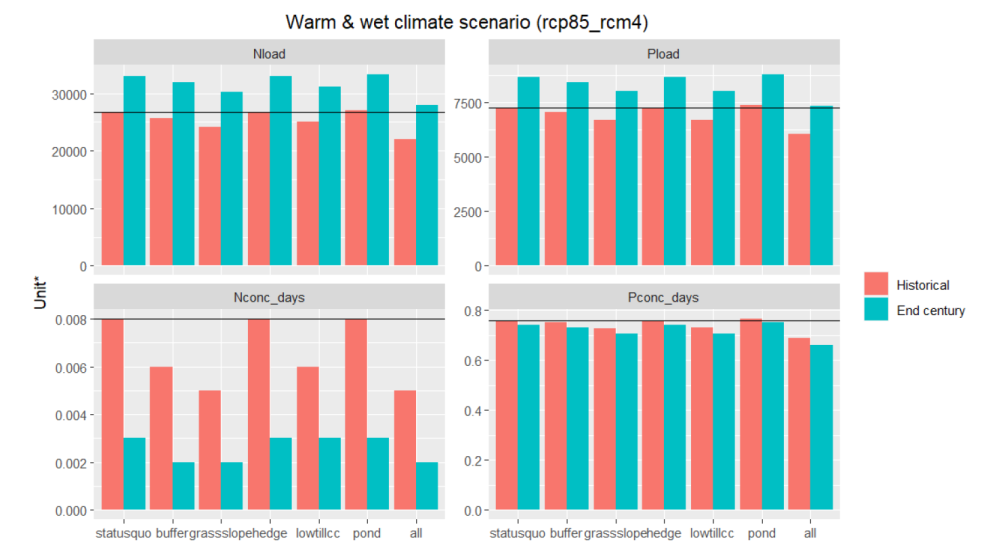
Figure 9 Comparison between the combined climate change + NSWRM scenarios for selected crop yield indicators in CS1.
The results illustrate simulated indicator values for a single climate scenario called “Warm & wet”. The units are [-] for grain units and [t/ha] for crop yields. Black line refers to the indicator level for the historical ‘statusquo’ scenario that serves as a reference.